
By Robin WenData as of
Alumina Manufacturers: Who Refines What
Lists of producers disagree because one counts installed capacity and another counts output. Here is who refines alumina, on which measure, and as of when.
On this page
The largest alumina manufacturers are counted in two different currencies, and a list that omits the measure cannot be compared with one that gives it. Alcoa reports 17 million tonnes of installed capacity across six refineries. Shandong Hongqiao reports 20.14 million tonnes of alumina output for 2025. Put those two figures in one column and the ranking means nothing: one is what the plants could do, the other is what they did.
This page lists the producers whose numbers I could verify from the company itself, states which measure each figure uses, and gives the cutoff. Data as of November 2026. There is no quality ranking here, and no list padded to ten names.
Two lists, not one
The word “alumina” covers a commodity that goes into smelters and a set of specialty products that go into ceramics, catalysts and separators. The alumina manufacturers of the first kind are the subject of this page. The second is a much smaller business with different owners, and it is covered in the high-purity alumina guide and in what alumina is used for.
The split matters for anyone screening suppliers, because a company that can ship 5,000 tonnes a year of 4N powder and a company that can ship 17 million tonnes of smelter-grade alumina are not competitors in any sense a buyer would recognise. The tonnage side is a Bayer-process business: bauxite is digested in caustic liquor, the alumina is precipitated as hydrate, and the hydrate is calcined to smelter grade. A refinery’s output is therefore set by ore quality, caustic balance and calcination capacity before it is set by anything a buyer asks for.
The refiners, one by one
The order below is not a ranking. Each entry carries the measure its figure uses, and states a date wherever the company gives one, because those two things differ from company to company and cannot be normalised without inventing a number.

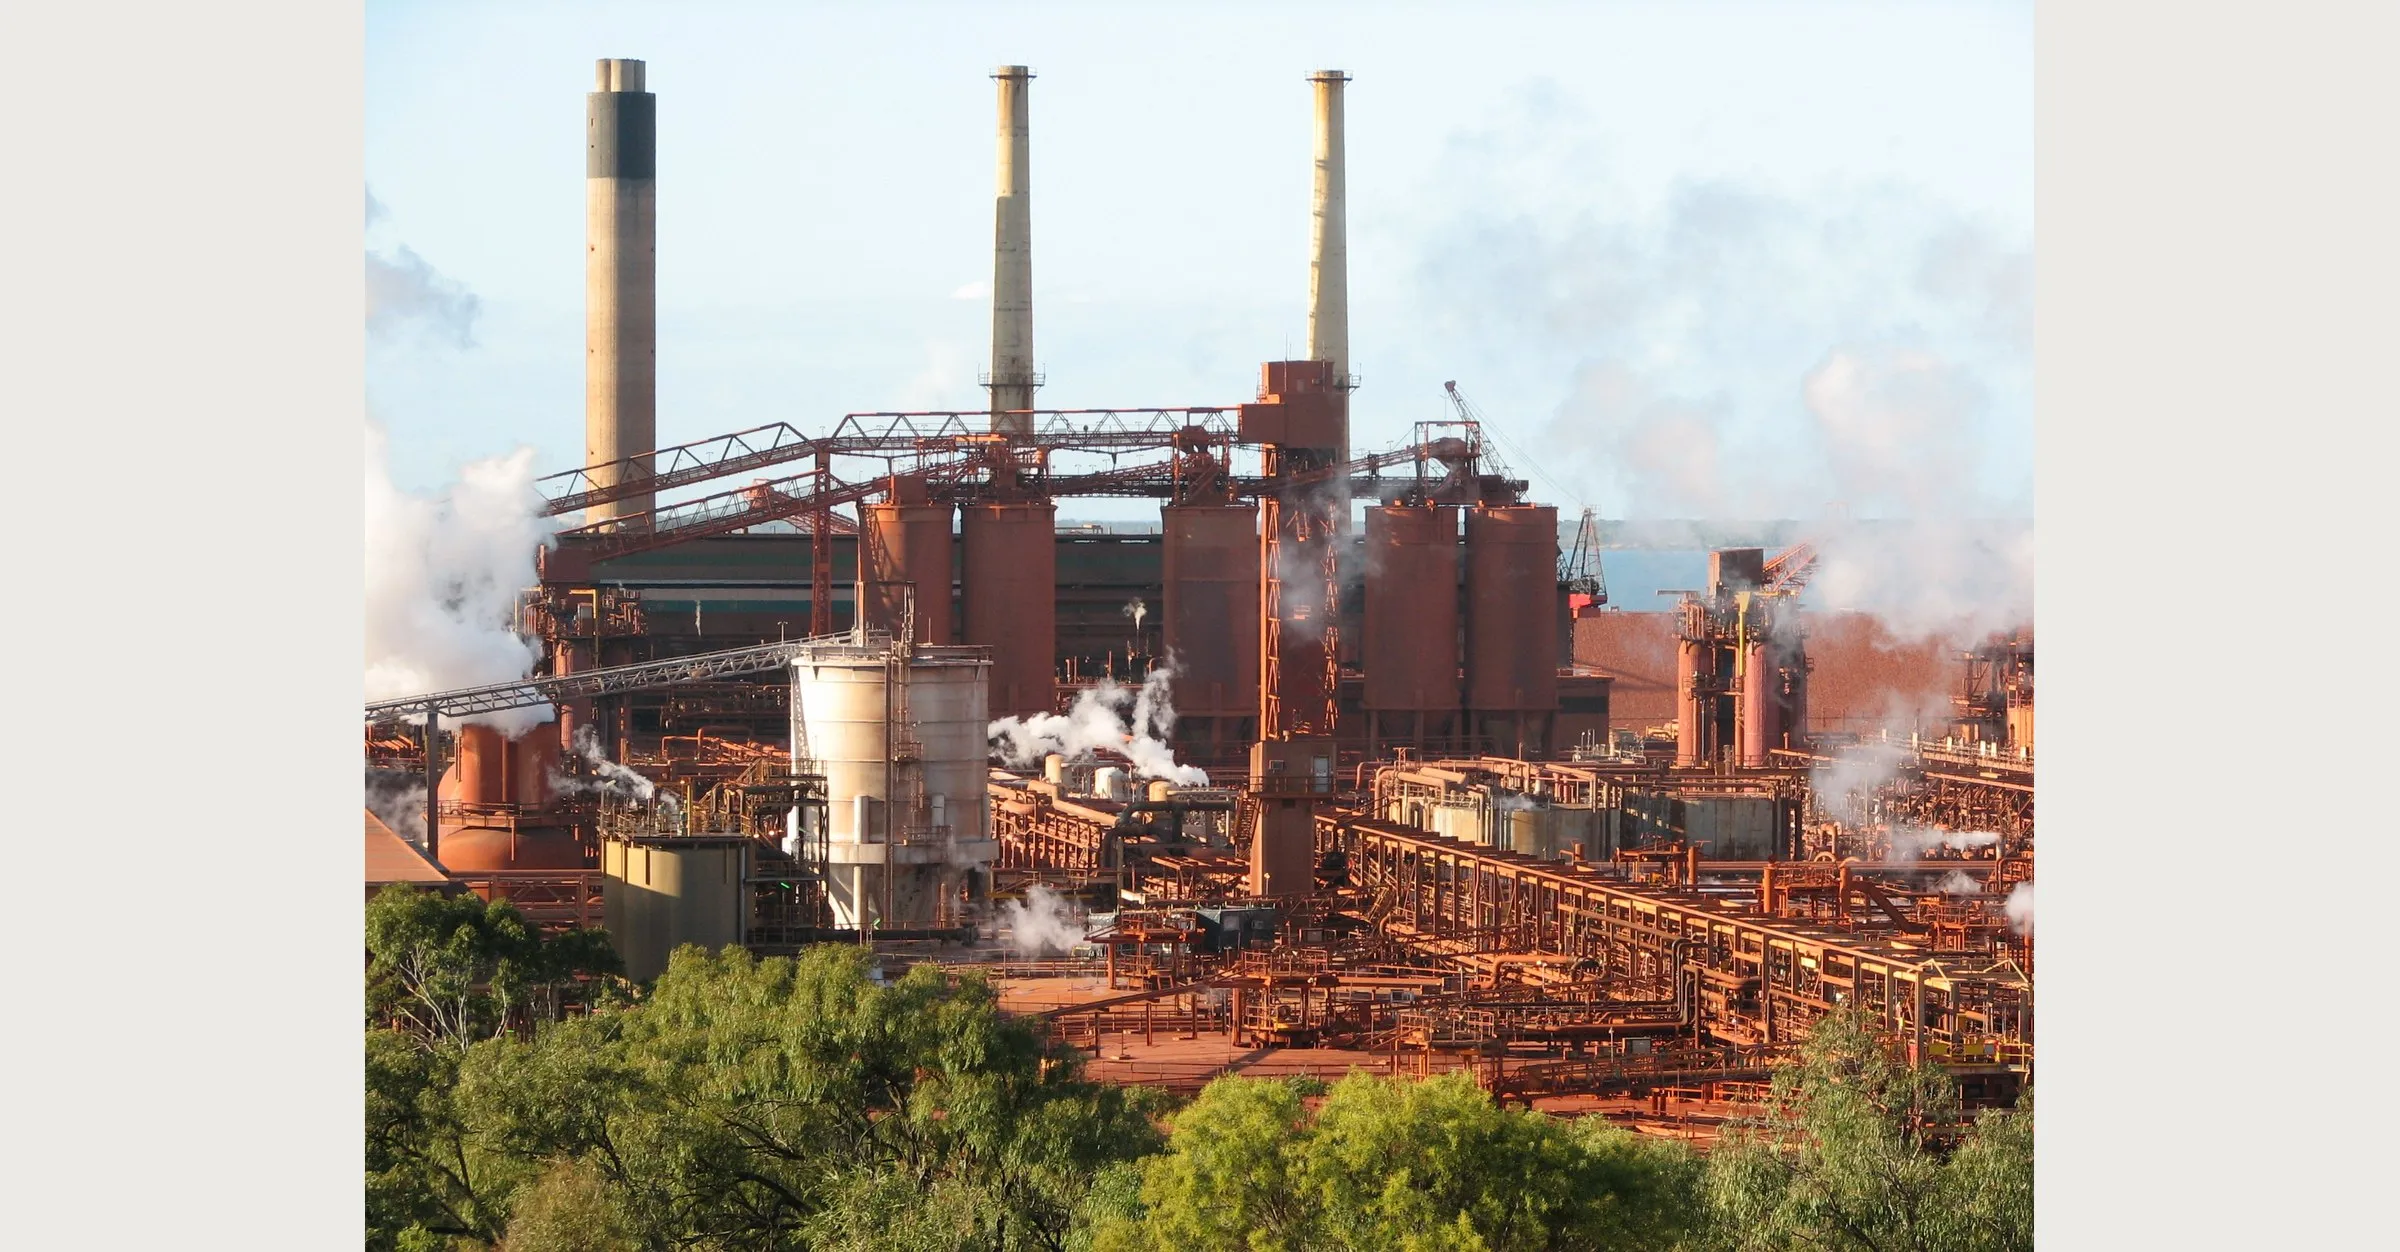
Alcoa (United States) reports 17.0 million tonnes a year of installed capacity across six refineries in Australia, Brazil and Spain, on its product page as accessed in 2026. The company calls itself the largest third-party producer of alumina, meaning most of its output is sold rather than consumed in its own smelters, and describes its Western Australian three-refinery complex as able to supply about 8% of the global market. Both of those are company characterisations; the capacity figure is the auditable part.

Hydro (Norway) gives Alunorte in Barcarena, Brazil a nominal capacity of 6.3 million tonnes a year, on its own site as accessed in 2026, and describes the plant as the world’s largest alumina refinery outside China. The capacity figure is the one to hold loosely this year: in August 2026 the company cut production at Alunorte to 50% after its gas supplier reported disruptions.

Rio Tinto (Australia and United Kingdom) describes Queensland Alumina at Gladstone as producing about 3.7 million tonnes a year, which is output language rather than capacity language. The plant is an independently managed joint venture owned 80% by Rio Tinto and 20% by Rusal, so this is an operated figure attached to a partly-owned asset. In November 2025 it announced a reduction at its Yarwun refinery from October 2026, cutting annual output by about 1.2 million tonnes while extending the plant’s operating life.

Shandong Hongqiao Aluminium Holdings (002379) (China) reported output of 20.14 million tonnes of alumina for 2025 in its annual report summary. This is the largest company-level figure on the page and the least comparable one: it is a group’s produced tonnage, published on a Chinese reporting calendar, against competitors’ capacity figures. The A-share entity sits inside the China Hongqiao group (1378.HK), whose own subsidiary list carries the listed vehicle under its pre-2026 name, 山东宏创铝业控股.

Hindalco (India, Aditya Birla group) gives Utkal Alumina a capacity of 2.12 million tonnes a year, the figure reached when the refinery was expanded in August 2021. Utkal is one refinery, not the group’s whole alumina position, and the company publishes it as a plant-level capacity.

Emirates Global Aluminium (United Arab Emirates) describes Al Taweelah as producing over two million tonnes a year, and reports 2.4 million tonnes of output for 2025. That figure is company-reported output for 2025, not a nameplate capacity.
Six named refiners, each reporting on its own measure. The national totals below are a different kind of number: they cover every refinery in one country, and they disagree with each other in ways this page reports rather than resolves.
Capacity and output are not the same number
Three different quantities circulate under the label “capacity”, and they are not interchangeable.
Installed capacity is what the equipment is designed to produce. Effective capacity is what it can produce given ore quality, energy supply and bottlenecks. Output is what it did produce. A refinery running on lower-grade bauxite or short of gas can sit far below its installed figure for a year, which is why the same plant appears at different sizes in different databases.
The consequence for a buyer is practical. A supplier quoting installed capacity is quoting an offer, and a supplier quoting output is quoting a track record. Contracts are written against the first and delivered by the second.
Any list of alumina manufacturers that mixes the two measures is setting an intention against a result. That is also why the six figures above cannot be ranked against each other. Alcoa’s 17 million tonnes and Hongqiao’s 20.14 million tonnes are a capacity figure and an output figure; comparing them would be arithmetic without meaning.
China refines more than half the world’s alumina
China’s alumina manufacturers produced 94.4 million tonnes in 2025, of which 89.3 million tonnes was metallurgical grade and 5.2 million tonnes was chemical grade, according to the China Nonferrous Metals Industry Association (CNIA, domestic alumina market review, March 2026). Against the USGS estimate of 150 million tonnes of world production for 2025, that is roughly 63%, though the ratio is my arithmetic on two different statistical systems rather than a published share (USGS, Mineral Commodity Summaries 2026).
Capacity sits higher than output, and the capacity figure is contested in the same way: the industry association reports 108 million tonnes of capacity for the same year where Antaike reports 114.8 million, a 6.8 million tonne gap that this page reports rather than averages. Antaike data cited in a 2026 credit report put China’s installed alumina capacity at 114.8 million tonnes a year at the end of 2025 (Antaike data as cited in a China Aluminum Corporation credit report).
Here is where a producer list stops being a list. The same credit report gives China’s 2025 alumina production as 92.9 million tonnes on Antaike’s count, while the industry association reports 94.4 million tonnes. The gap is 1.5 million tonnes, about 1.6%, and neither source explains it. I have not been able to reconcile the two, so both are reported here rather than averaged into a false precision.
What moved in 2026
Producer lists age faster than their publication dates suggest. Three events since late 2025 moved tonnage, or are due to move it, between alumina producers.
On 1 July 2026, South32 signed a binding conditional agreement to sell its aluminium value chain assets, including its 86% interest in Worsley Alumina, to Alcoa, with completion expected in the second half of FY27 (South32, Worsley Alumina). The agreement is conditional, so ownership has not changed yet. A list published before that date is describing a structure that is due to change.
Rio Tinto said in November 2025 that it would cut production at its Yarwun refinery from October 2026, reducing annual output by about 1.2 million tonnes while extending the plant’s operating life (Rio Tinto announcement).
And Alunorte, which Hydro describes as the world’s largest alumina refinery outside China, cut production to 50% in August 2026 after its gas supplier reported disruptions (Hydro, Alunorte reduces alumina production). A plant’s nominal figure survives those events on paper and does not survive them in a contract.
How to read an alumina suppliers list
For a buyer or an analyst who has to use someone else’s list, four questions separate a useful document from a decorative one.
First, what is the denominator: capacity, output, or shipments, and does it cover one refinery, one company or one country? Second, is the figure equity-adjusted or operated? A 40% shareholder in a 4 million tonne refinery does not control 4 million tonnes. Third, what is the cutoff date, given how often ownership changes. Fourth, does the list mix grades, because smelter-grade and chemical-grade alumina are counted in the same national totals and sold to different customers.
Alumina suppliers answer those questions differently, which is why two lists of the same industry can disagree without either being dishonest.
The silicon carbide suppliers guide applies the same discipline to a material where the split is by grade rather than by refinery. The other supplier pages are collected under suppliers.
Methodology
Producer figures come from company publications accessed in November 2026: Alcoa’s alumina page, Hydro’s Alunorte page, Rio Tinto’s Queensland Alumina page and its November 2025 production announcement, Emirates Global Aluminium’s Al Taweelah refinery page, including its 2025 output figure, Aditya Birla’s page for Utkal, South32’s Worsley page, and Shandong Hongqiao’s 2025 annual report summary. Chinese national figures come from the China Nonferrous Metals Industry Association and from Antaike data cited in a 2026 credit report; the two disagree on 2025 output and both are reported.
Company logos are the marks each company publishes on its own site, shown for identification only; no product photographs from press materials are reproduced. Alcoa publishes its mark in white only, so it was recoloured to a dark neutral to stay visible on a light background.
Two limits apply. I did not verify plant-level capacity for any Chinese producer. Hongqiao’s figure is output, not capacity, and for the Chinese industry the national aggregates are the only capacity numbers published at all — which is why this page reports two of them. And this page is not audited: figures are as the companies state them, on the measures they chose, which is the central problem the page describes.
Sources
- Alcoa, “Alumina” product page, accessed November 2026. https://www.alcoa.com/global/en/what-we-do/alumina
- Hydro, “Alunorte”, accessed November 2026. https://www.hydro.com/en/global/about-hydro/hydro-worldwide/americas/brazil/barcarena/alunorte/
- Rio Tinto, “Queensland Alumina Limited”, accessed November 2026. https://www.riotinto.com/en/operations/anz/gladstone/queensland-alumina-limited
- Rio Tinto, announcement on reducing production at Yarwun Alumina Refinery, November 2025. https://www.riotinto.com/en/news/releases/2025/rio-tinto-to-reduce-production-at-yarwun-alumina-refinery-to-extend-operational-life
- South32, “Worsley Alumina”, accessed November 2026. https://www.south32.net/what-we-do/our-locations/australia/worsley-alumina
- Emirates Global Aluminium, Al Taweelah alumina refinery, and 2025 production as reported by the company, accessed 2026. https://www.ega.ae/en/about-us/operations/al-taweelah-alumina-refinery
- Hydro, “Alunorte reduces alumina production on natural gas supply disruptions”, 2026. https://www.hydro.com/en/global/media/news/2026/alunorte-reduces-alumina-production-on-natural-gas-supply-disruptions/
- Aditya Birla Group, “Utkal Alumina International Limited”, accessed November 2026. https://www.adityabirla.com/en/businesses/companies/utkal-alumina-international-limited-uail/
- 山东宏桥铝业控股股份有限公司, 2025 年度报告摘要 (Shandong Hongqiao 2025 annual report summary). http://static.cninfo.com.cn/finalpage/2026-03-21/1225021358.PDF
- 中国有色金属工业网, “国内氧化铝市场回顾及展望”, March 2026. https://www.chinania.org.cn/html/hangyetongji/tongji/2026/0309/60569.html
- Antaike data as cited in a 2026 credit report on Aluminum Corporation of China. https://www.chinamoney.com.cn/dqs/cm-s-notice-query/fileDownLoad.do?contentId=3345150&priority=0&mode=save
- US Geological Survey, Mineral Commodity Summaries 2026: Bauxite and Alumina, 2026. https://pubs.usgs.gov/periodicals/mcs2026/mcs2026-bauxite-alumina.pdf
- China Hongqiao Group, subsidiary list. http://www.hongqiaochina.com/info.html