· Robin Wen · Industry & Manufacturing · 13 min read
China Is Australia's Top Car Source, and That Counts Factories
China took 35.5 per cent of Australia's new-car sales in September. The figure counts factories, not badges.
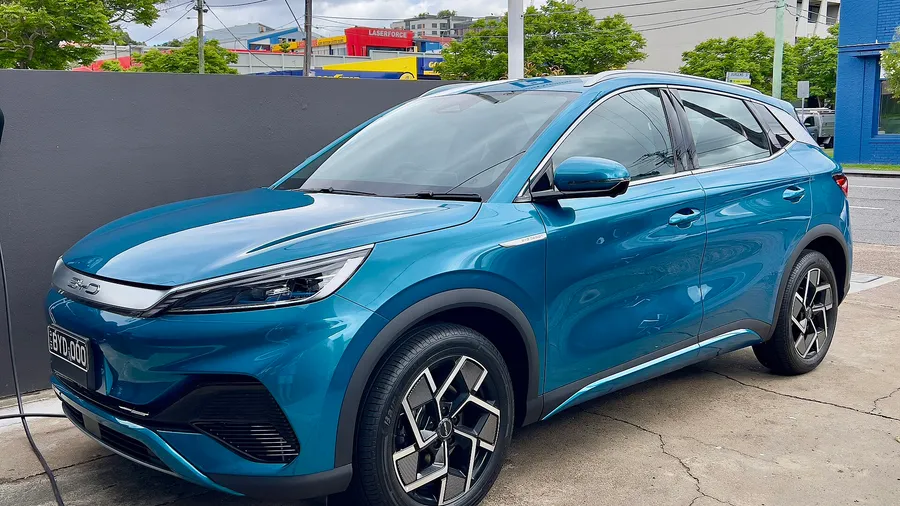
Photo: BYD Atto 3, Brisbane, October 2022 · Kgbo · CC BY-SA 4.0 · Wikimedia Commons
On 6 October the Federal Chamber of Automotive Industries reported that Australians bought 102,924 new vehicles in September, 0.9 per cent more than a year earlier. Cars built in China took 35.5 per cent of them. Japan supplied 22.5 per cent, Thailand 17.3 per cent and South Korea 9.6 per cent (FCAI, 6 October).
That makes China the largest single source of Australia’s new cars, and how much larger it looks depends on which pool is counted. The VFACTS tally excludes Tesla and Polestar, which report through the Electric Vehicle Council instead. Add those 5,854 cars and the September market becomes 108,778 vehicles, of which 42,045 were built in China and 40,933 in Japan and Thailand together, so that on the wider pool China out-supplies the other two combined. CarExpert puts Chinese-built vehicles at 38.9 per cent of the Australian new-car market (GoAuto, 6 October; CarExpert). On the wider pool, CarExpert notes, September repeated a milestone China first reached in June, when it passed Japan and Thailand together for the first time.
Toyota led September with 17,682 cars, BYD was second on 8,191 and Ford third on 7,592. Five Chinese marques sat in the FCAI’s top ten: BYD, GWM, MG, Geely and Chery (FCAI, 6 October).
My reading is that the source-country figure and the brand table answer different questions, and the first is the more consequential one.
| September 2026, new vehicles by source | Share of VFACTS sales |
|---|---|
| China | 35.5% |
| Japan | 22.5% |
| Thailand | 17.3% |
| South Korea | 9.6% |
Sources: FCAI, 6 October. The VFACTS total for September was 102,924 vehicles and excludes Tesla and Polestar. Adding the 5,854 Tesla and Polestar registrations reported through the Electric Vehicle Council gives a market of 108,778, of which 42,045 were built in China and 40,933 in Japan and Thailand together (GoAuto, 6 October; CarExpert). The two shares use different pools and are not comparable.
The Share Counts Factories
“Sourced from China” records where the vehicle was assembled, not who owns the badge. The pool now includes cars from Mazda, Hyundai, Kia, BMW and Mini, with Nissan and Ford due to join them, CarExpert reports (CarExpert). Tesla’s Model Y, third across the combined market in September on 4,476 deliveries, is counted as Chinese-built by CarExpert (GoAuto). CarExpert excludes two models it cannot assign to a plant, the Model Y Performance and the Polestar 3, because those can also come from Germany or the United States.
The FCAI does not publish a brand-by-origin split, so how much of the 35.5 per cent carries a Chinese badge and how much carries a Mazda or Hyundai one is not in the release. CarExpert’s list shows the direction: the brands that built the largest categories of Australia’s imports are moving their own supply to the same plants. The supplier base is the reason a battery maker’s first production line went to Jiangsu rather than Kentucky.
That distinction decides how durable the share is. A share that depends on shoppers choosing a new badge can move back when the badge loses its price advantage. A share that has moved inside the purchasing lists of Mazda, Hyundai and Kia does not move with consumer sentiment, because it was settled before the showroom. The scale behind it is also what sets a carmaker’s terms with the firms further down, a subject this site has looked at in the Chinese supply chain.
Why Australia Charged Nothing
Australia levies no customs duty on a car built in China. The general rate on an imported passenger car here is 5 per cent, and the China-Australia Free Trade Agreement, in force since December 2015, took that to zero for goods of Chinese origin (AADA; IEA; DFAT). Battery-electric, plug-in hybrid and hydrogen fuel-cell cars below the fuel-efficient luxury car tax threshold have also carried no customs duty since July 2022, with an exception for Russia and Belarus, which attract an additional 35 per cent duty (Australian Border Force, Customs Notice 2022/34).
The contrast is the point. A car built in China enters the European Union under a countervailing duty applicable since 30 October 2024: 17 per cent for BYD, 18.8 per cent for Geely, 20.7 per cent for other cooperating exporters and 35.3 per cent for SAIC and for companies that did not cooperate with the investigation, with Tesla’s Shanghai-built cars at the bottom of the range on 7.8 per cent (European Commission). Australia applies none of that to the same vehicles. That is the experiment the Spanish numbers run in reverse: there, the duty was drawn at the battery and the market moved to the half it did not cover; here there is no line to move across.
Demand then moved the same way as supply. Battery-electric cars were 24.2 per cent of September’s sales, against 11.3 per cent a year earlier. Plug-in hybrids rose 122.7 per cent year on year, petrol fell 36.2 per cent and diesel 18.4 per cent (FCAI, 6 October). For the year to date, battery cars are 18.9 per cent of the market, against 8.1 per cent at the same point of 2025. Over the first nine months of 2025, 77.5 per cent of the battery-electric cars sold in Australia came from China (FCAI, 3 October 2025).
So the open border and the change of powertrain point at the same supplier. The duty decides which cars can be sold cheaply; the charging decision decides which cars are wanted. My reading is that these are compounding rather than separate.
Where the Ute Still Holds
September’s best-selling vehicle was not Chinese. It was the Ford Ranger, on 5,062 deliveries, built in Thailand. The Toyota HiLux was third in that list on 4,455, also Thai, and the Isuzu D-Max ninth on 1,866, so three of the ten are utes (FCAI; CarExpert). Five of the ten carry Chinese brands: the BYD Sealion 7 on 2,687, the Chery Tiggo 4 on 2,059, the GWM Haval Jolion on 2,018, the Geely EX5 on 2,008 and the MG ZS, tenth on 1,805. None of them is a ute.
The ute is the one large segment where the best-selling names are all established, and it is moving underneath. Chinese-brand utes went from about 15,600 in 2024 to just under 37,700 in 2025, lifting their share of the segment from 6.8 to 16 per cent, and to 17.6 per cent across the first two months of this year (CarsGuide, 3 April). A single model did most of it: about 18,000 of those 2025 utes were BYD’s plug-in hybrid Shark 6.
The demand under the segment is thinning at the same time. Private ute sales fell from about 70,000 in the first nine months of 2025 to about 55,000 in the same period this year, and light commercial deliveries were down 13.2 per cent in September (news.com.au, 6 October; FCAI).
My reading is that the ute is the last open segment, and the incumbents’ lead in it is intact but narrowing. If no Chinese ute reaches the monthly top ten through 2027, the segment has held. If one does, the source-country figure has somewhere left to go.
Three Numbers
Three numbers will settle how this reads in a year.
The first is the 35.5 per cent itself, and its weakness is the pool. The FCAI figure excludes Tesla and Polestar; the 38.9 per cent does not. If the VFACTS share stalls while the combined figure keeps rising, the growth belongs to Tesla’s Chinese-built cars and to the established brands’ Chinese lines rather than to new Chinese marques, and the factories reading holds. If both rise together, the two stories are running as one.
The second is whether a Chinese ute enters the monthly top ten, which the FCAI publishes with the rest of its model table. One month would not settle it; a full year would.
The third is the total market, which grew 0.9 per cent in September. On a flat pool, a share gain is a redistribution, and the 35.5 per cent has been taken from someone. Which brand it came from is the number the brand table will show next.
What would move my reading is a VFACTS share that climbs while the Chinese-built, non-Chinese-badge part of that figure falls. That would make this a brand contest after all, and the procurement argument above would not hold. A rule drawn on a definition invites exactly that kind of move, so the ute and the badges are worth watching separately rather than only in the total.
Methodology
Two limits apply, and each figure here carries its own pool. The FCAI’s VFACTS data exclude Tesla and Polestar, which report through the Electric Vehicle Council, so 35.5 per cent is a share of VFACTS sales alone. The 42,045, the 40,933 and the 38.9 per cent come from CarExpert combining VFACTS with the council’s data, and they exclude two models CarExpert could not assign to a plant. Second, “sourced from China” classifies where a vehicle was assembled, and the FCAI does not publish a breakdown by brand inside it, so the split between Chinese-brand and other-brand Chinese-built cars is described here rather than counted. CarExpert’s own 38.9 per cent share does not divide out exactly from the 42,045 vehicles and the 108,778 market that it and GoAuto report, since its share excludes two models its count includes; I give both as the two sources publish them. The diesel figures of 16.5 per cent for the year to date and 24.5 per cent for diesel SUVs, and the private-ute figures of about 70,000 and 55,000, are news.com.au’s reading of the data; the FCAI’s own release gives diesel down 18.4 per cent for September alone.
Sources
- Federal Chamber of Automotive Industries, “Sales edge higher amid shifting buyer preferences”, 6 October 2026 — the core source for September: 102,924 VFACTS sales, up 0.9 per cent; China at 35.5 per cent of the market, Japan 22.5, Thailand 17.3 and South Korea 9.6 per cent; battery-electric cars at 24.2 per cent against 11.3 per cent a year earlier; plug-in hybrids up 122.7 per cent, hybrids up 20.7, petrol down 36.2 and diesel down 18.4 per cent; battery cars at 18.9 per cent year to date against 8.1 per cent; light commercial vehicles down 13.2 per cent; the top ten brands and the top ten models — fcai.com.au
- Federal Chamber of Automotive Industries, “New vehicle sales remain strong in September”, 3 October 2025 — the year-earlier baseline: 101,992 sales; China the second-largest source country; China supplying 77.5 per cent of the year’s battery-electric sales; that powertrain at 11.3 per cent of the month — fcai.com.au
- GoAuto, “VFACTS: EV sales strong in September”, 6 October 2026 — the reporting split: 102,924 VFACTS sales plus 5,854 Tesla and Polestar registrations reported through the Electric Vehicle Council, for 108,778; VFACTS excludes both brands; the Model Y’s 4,476 deliveries ranking third across the combined market; battery cars above 24 per cent for a second month; China at about 40.3 per cent of the combined August market — goauto.com.au
- CarExpert, “Chinese vehicles outsell those from Japan and Thailand combined”, October 2026 — the combined figures: 42,045 vehicles built in China against 40,933 from Japan and Thailand together; Chinese-built vehicles put at 38.9 per cent of the Australian new-car market; the June first, when China passed both at once; the exclusion of the Model Y Performance and Polestar 3 because those can be sourced from Germany or the United States; Chinese-built cars from Mazda, Hyundai, Kia, BMW and Mini, with Nissan and Ford to follow; the Ford Ranger and Toyota HiLux as Thai-built — carexpert.com.au
- GoAuto, “VFACTS: Australia tops 1.24m sales in 2025”, 6 January 2026 — the 2025 baseline: 1,241,037 sales; vehicles of Chinese origin at about 18 per cent, up roughly four points on the year, making China the third-largest source country behind Japan and Thailand; SUVs at 60.7 per cent of the market and light commercial vehicles at 22.6 per cent; the Ranger as the year’s best-selling model — goauto.com.au
- news.com.au, “Electric cars outsell petrol vehicles in Australia”, David McCowen, 6 October 2026 — the diesel and ute figures: electric vehicles outselling petrol for a second month; diesel down about 16.5 per cent for the year to date and diesel SUVs down 24.5 per cent comparing September with September 2025; private ute sales falling from about 70,000 in the first nine months of 2025 to about 55,000 in the same period of 2026; Chinese cars at about 35 per cent of the month against about 18 per cent a year earlier — news.com.au
- CarsGuide, “BYD Shark 6’s dominance exposed as new car sales figures shows the 2026 Toyota HiLux, Ford Ranger rival is responsible for the massive growth of Chinese utes”, Chris Thompson, 3 April 2026 — the ute segment: Chinese-brand utes rising from about 15,600 in 2024 to just under 37,700 in 2025; their share of the segment moving from 6.8 to 16 per cent, and to 17.6 per cent across the first two months of 2026; about 18,000 of the 2025 units being BYD Shark 6s — carsguide.com.au
- Australian Automotive Dealer Association, “Automotive Taxation” — the general tariff rate: a 5 per cent duty on passenger vehicles entering Australia from countries without a free trade agreement — aada.asn.au
- Department of Foreign Affairs and Trade, “ChAFTA frequently asked questions” and “Guide to using ChAFTA to export or import” — the agreement’s terms: entry into force on 20 December 2015; Australian import tariffs at zero on 82 per cent of China’s exports from day one, reaching full elimination on 1 January 2019 — dfat.gov.au
- International Energy Agency, policy database, “China-Australia Free Trade Agreement (ChAFTA)” — the car-specific line: the tariff on motor cars for the transport of persons reduced from 5 per cent to zero — iea.org
- Australian Border Force, Customs Notice 2022/34, “Removal of customs duty on certain electric vehicles”, 2022 — the electric-vehicle exemption: from 1 July 2022, customs duty set at a free rate for battery-electric, plug-in hybrid and hydrogen fuel-cell vehicles with a customs value below the fuel-efficient luxury car tax threshold, applying to all such goods except those from Russia and Belarus, which carry an additional 35 per cent duty — abf.gov.au
- European Commission, Access2Markets, “EU Commission imposes countervailing duties on imports of battery electric vehicles (BEVs) from China”, 12 December 2024, on Implementing Regulation (EU) 2024/2754 — the comparison: the duties applicable as of 30 October 2024, at 7.8 per cent for Tesla Shanghai, 17.0 per cent for BYD, 18.8 per cent for Geely, 20.7 per cent for other cooperating companies and 35.3 per cent for SAIC and for non-cooperating companies — trade.ec.europa.eu
- Wikimedia Commons, “BYD ATTO 3 in Brisbane, Australia, 2022” — the header photograph: BYD Atto 3, Brisbane, 14 October 2022, by Kgbo, CC BY-SA 4.0 — commons.wikimedia.org